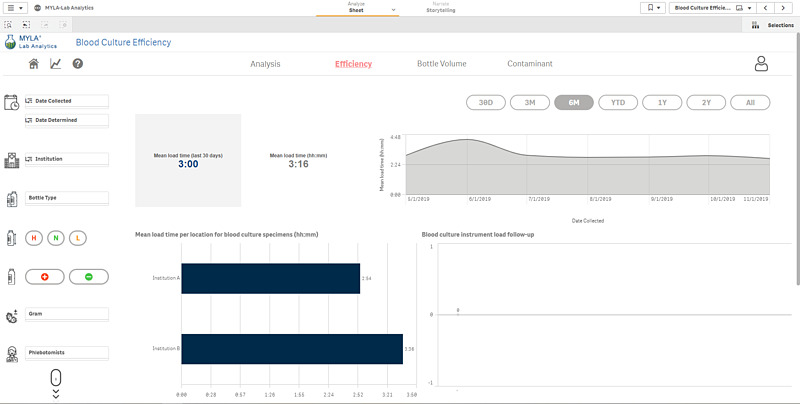
The blood culture dashboards in MYLA Lab Analytics contain data derived from your bioMérieux blood culture system—things like positivity rate, time-to-result, mean load times, contamination rates, and more.
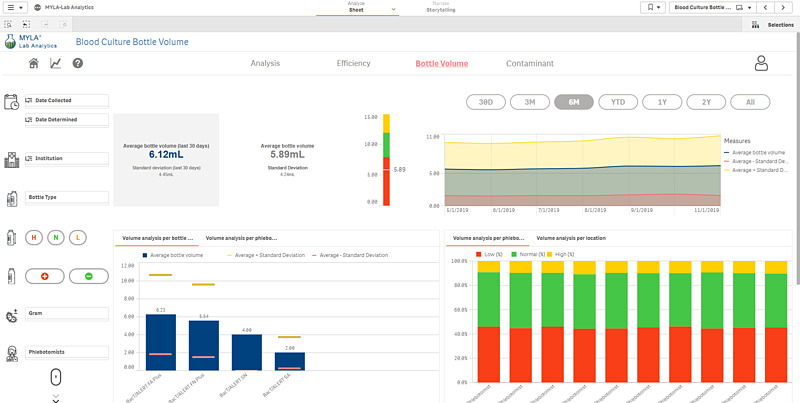
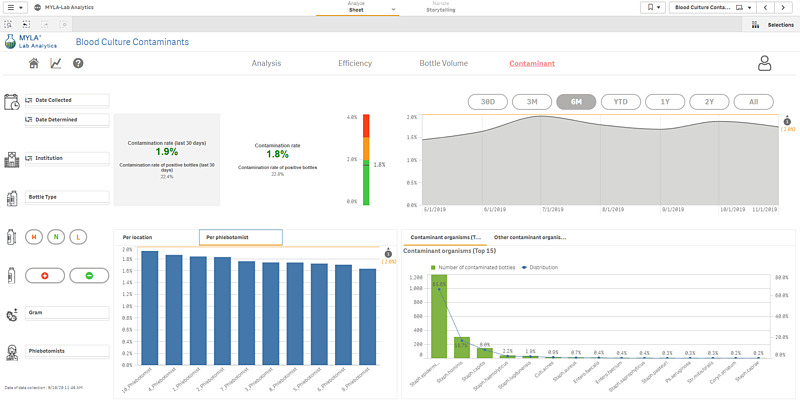
There are three specific dashboards here: the analysis page, a blood fill volume sheet, and a contaminations page. The analysis page acts as a high-level overview of the blood culture workflow, while the latter two dashboards focus on two key areas of fill volume and contaminations. The fill volume page shows the average fill volume by phelbotomist and location, as well as how often the phlebotomists are in the normal, high, and low fill volume ranges. The contamination page shows the contaminaton rate per phelbotomist and location, highlighting trends over time. Filters can be applied to each dashboard to allow the page to tell a specific story towards blood culture management.